Channel Analytics
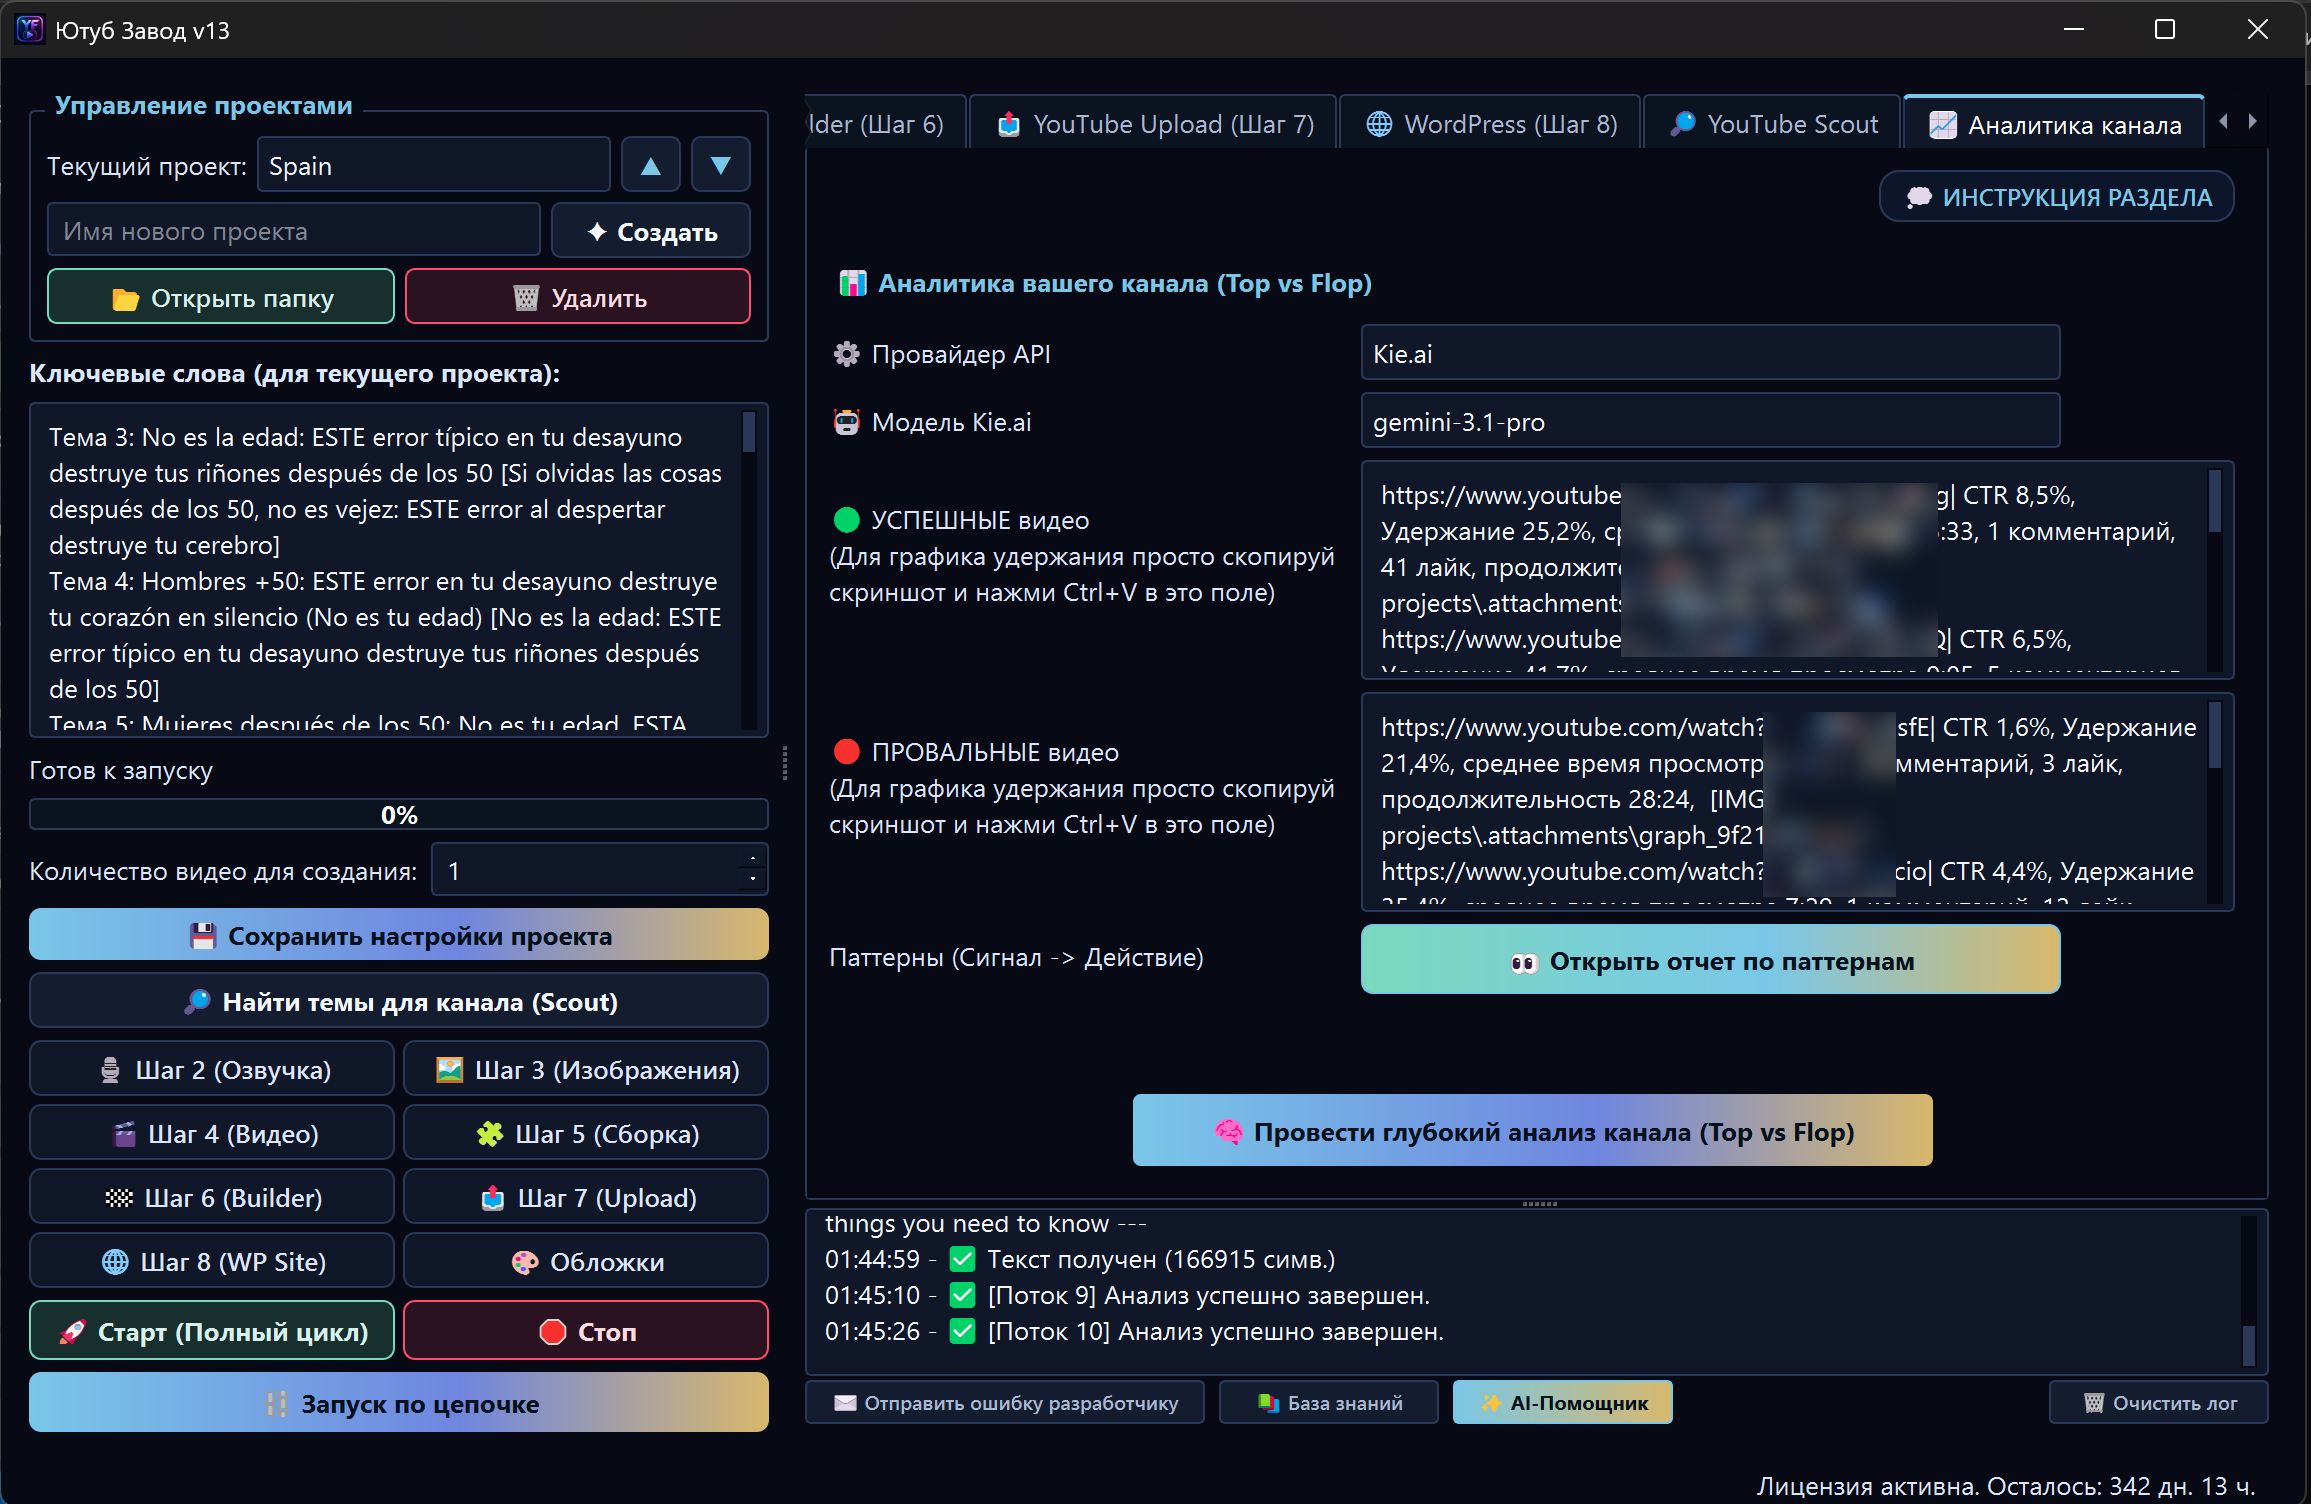
Channel Analytics in FOXI Studio is the Top vs Flop module. It compares successful and weak videos from your YouTube channel to understand why some videos gain views and others do not.
The idea is simple: do not guess what to improve. Compare real videos using links, metrics, and YouTube Studio screenshots. After analysis, FOXI creates a report with patterns and recommendations that can be applied through the AI Assistant or AI Configurator.
When to use Channel Analytics
Use this module if you already have published videos and want to understand:
- why the best videos worked;
- why weak videos did not get views;
- which topics should be repeated;
- which thumbnails attract viewers better;
- where scripts lose retention;
- which mistakes should be removed from future prompts;
- what should be passed to Scout and AI Configurator as channel rules.
If the channel is completely new and has no videos yet, start with YouTube Scout and create several test videos first.
What Top vs Flop means
Top means successful videos. Flop means weak videos.
Usually it is enough to provide:
| Group | How many videos | Which videos to use |
|---|---|---|
| Successful videos | 2–3 | Videos with high CTR, retention, views, or reactions |
| Weak videos | 2–3 | Videos clearly below the channel average |
FOXI analyzes not only the links but also the contrast between groups. Often the comparison reveals the problem: for example, successful videos start with a hook immediately, while weak videos spend the first 40 seconds too slowly.
What data to prepare
For each video, useful data includes:
- video link;
- CTR;
- retention;
- average view duration;
- likes;
- comments;
- video duration;
- screenshot of the retention graph from YouTube Studio.
The more specific metrics you provide, the more accurate the report will be.

How to fill video rows
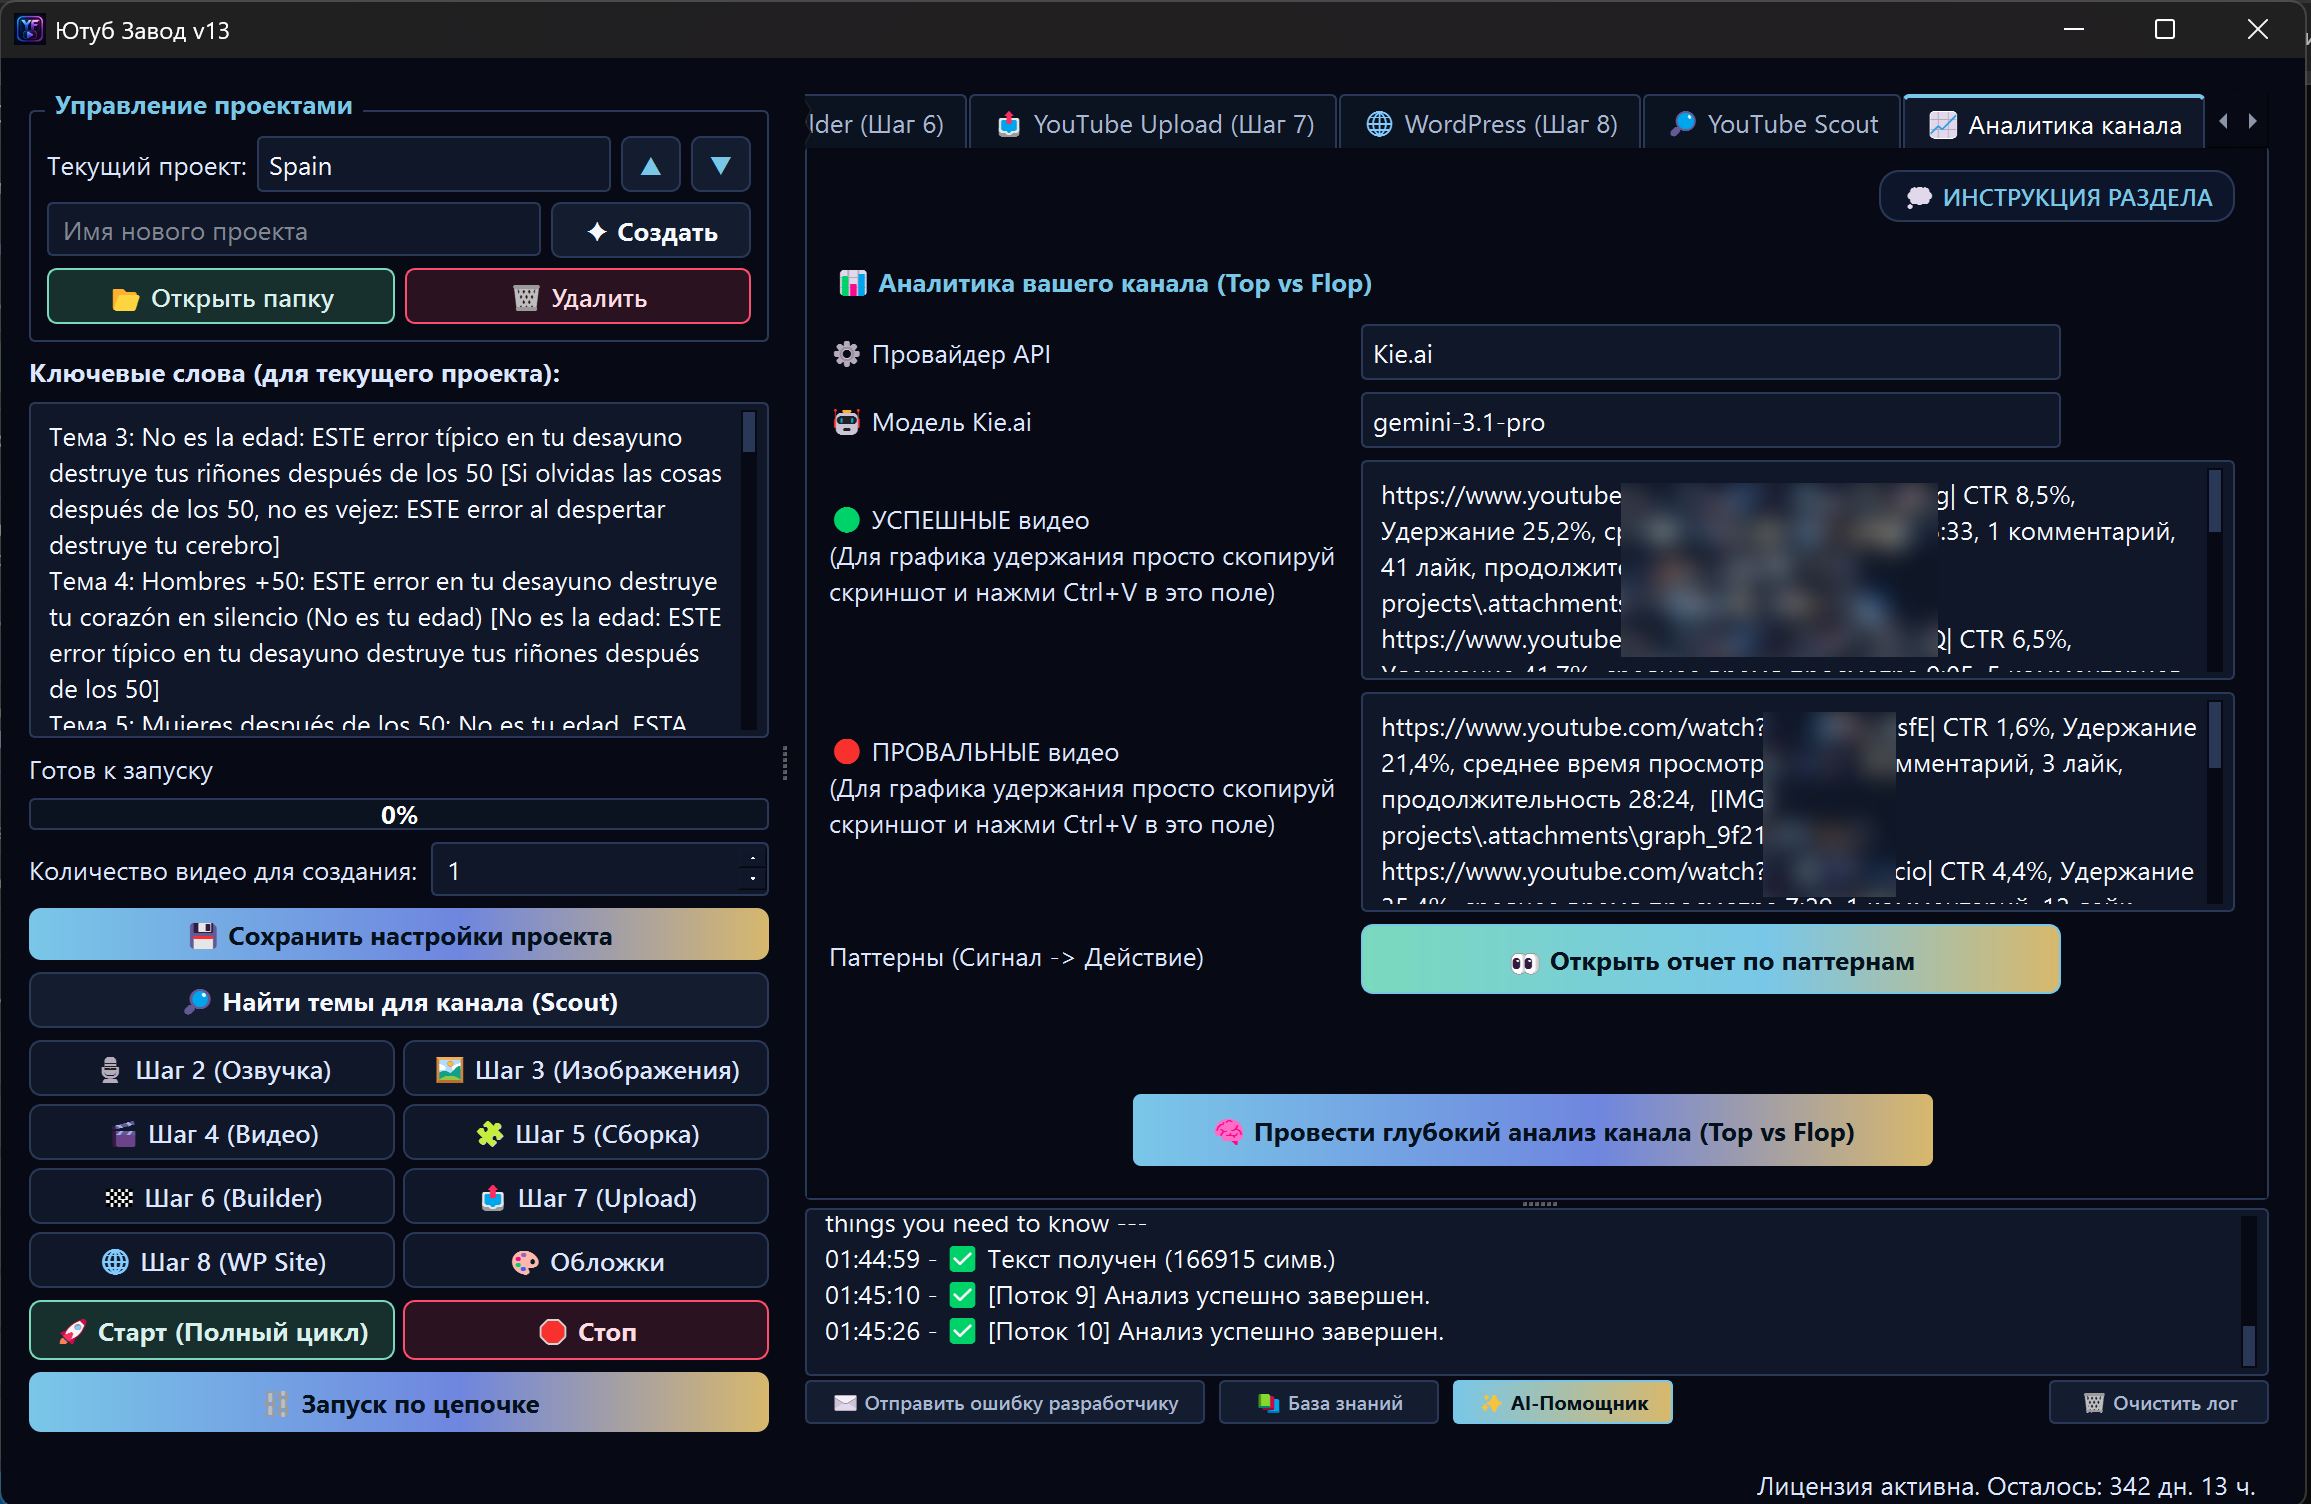
The interface has two zones: successful videos and failed videos. Add videos with “+ Successful” and “+ Failed” buttons.
In each row, provide the link and metrics. If the interface supports attaching a retention graph screenshot, add it to the relevant video.
Example row:
https://www.youtube.com/watch?v=VIDEO_ID | CTR 9.2%, retention 61%, average view duration 5:33, 1200 likes, 430 comments, length 10:15
Do not paste private data, emails, tokens, channel access credentials, or billing information.
Why the retention graph screenshot matters
The retention graph helps AI understand where viewers leave the video.
For example:
- a sharp drop at the start may indicate a weak hook;
- a drop in the middle may indicate a stretched section;
- strong ending retention may indicate a good payoff;
- small peaks may show interesting moments worth repeating.
The graph screenshot is especially useful when numbers look similar but viewer behavior is different.

Running analysis
After filling Top and Flop, choose a model if available and click “Run deep analysis”.
FOXI sends the task to the cloud server. The log will show launch and execution status. Analysis can take several minutes because AI compares links, metrics, structure, thumbnails, and your notes.
Do not close the page immediately if you want to watch status. The heavy processing runs in the cloud, so you can also check the result later.
What the Top vs Flop report contains
After completion, click “Open report”. The report usually includes:
- strong patterns from Top videos;
- weak patterns from Flop videos;
- hook differences;
- topic differences;
- thumbnail differences;
- script pacing differences;
- conclusions for future videos;
- recommendations for prompts, Scout, and AI Configurator.
How to apply conclusions
The report itself does not improve videos unless its conclusions are applied to the project.
There are two safe ways:
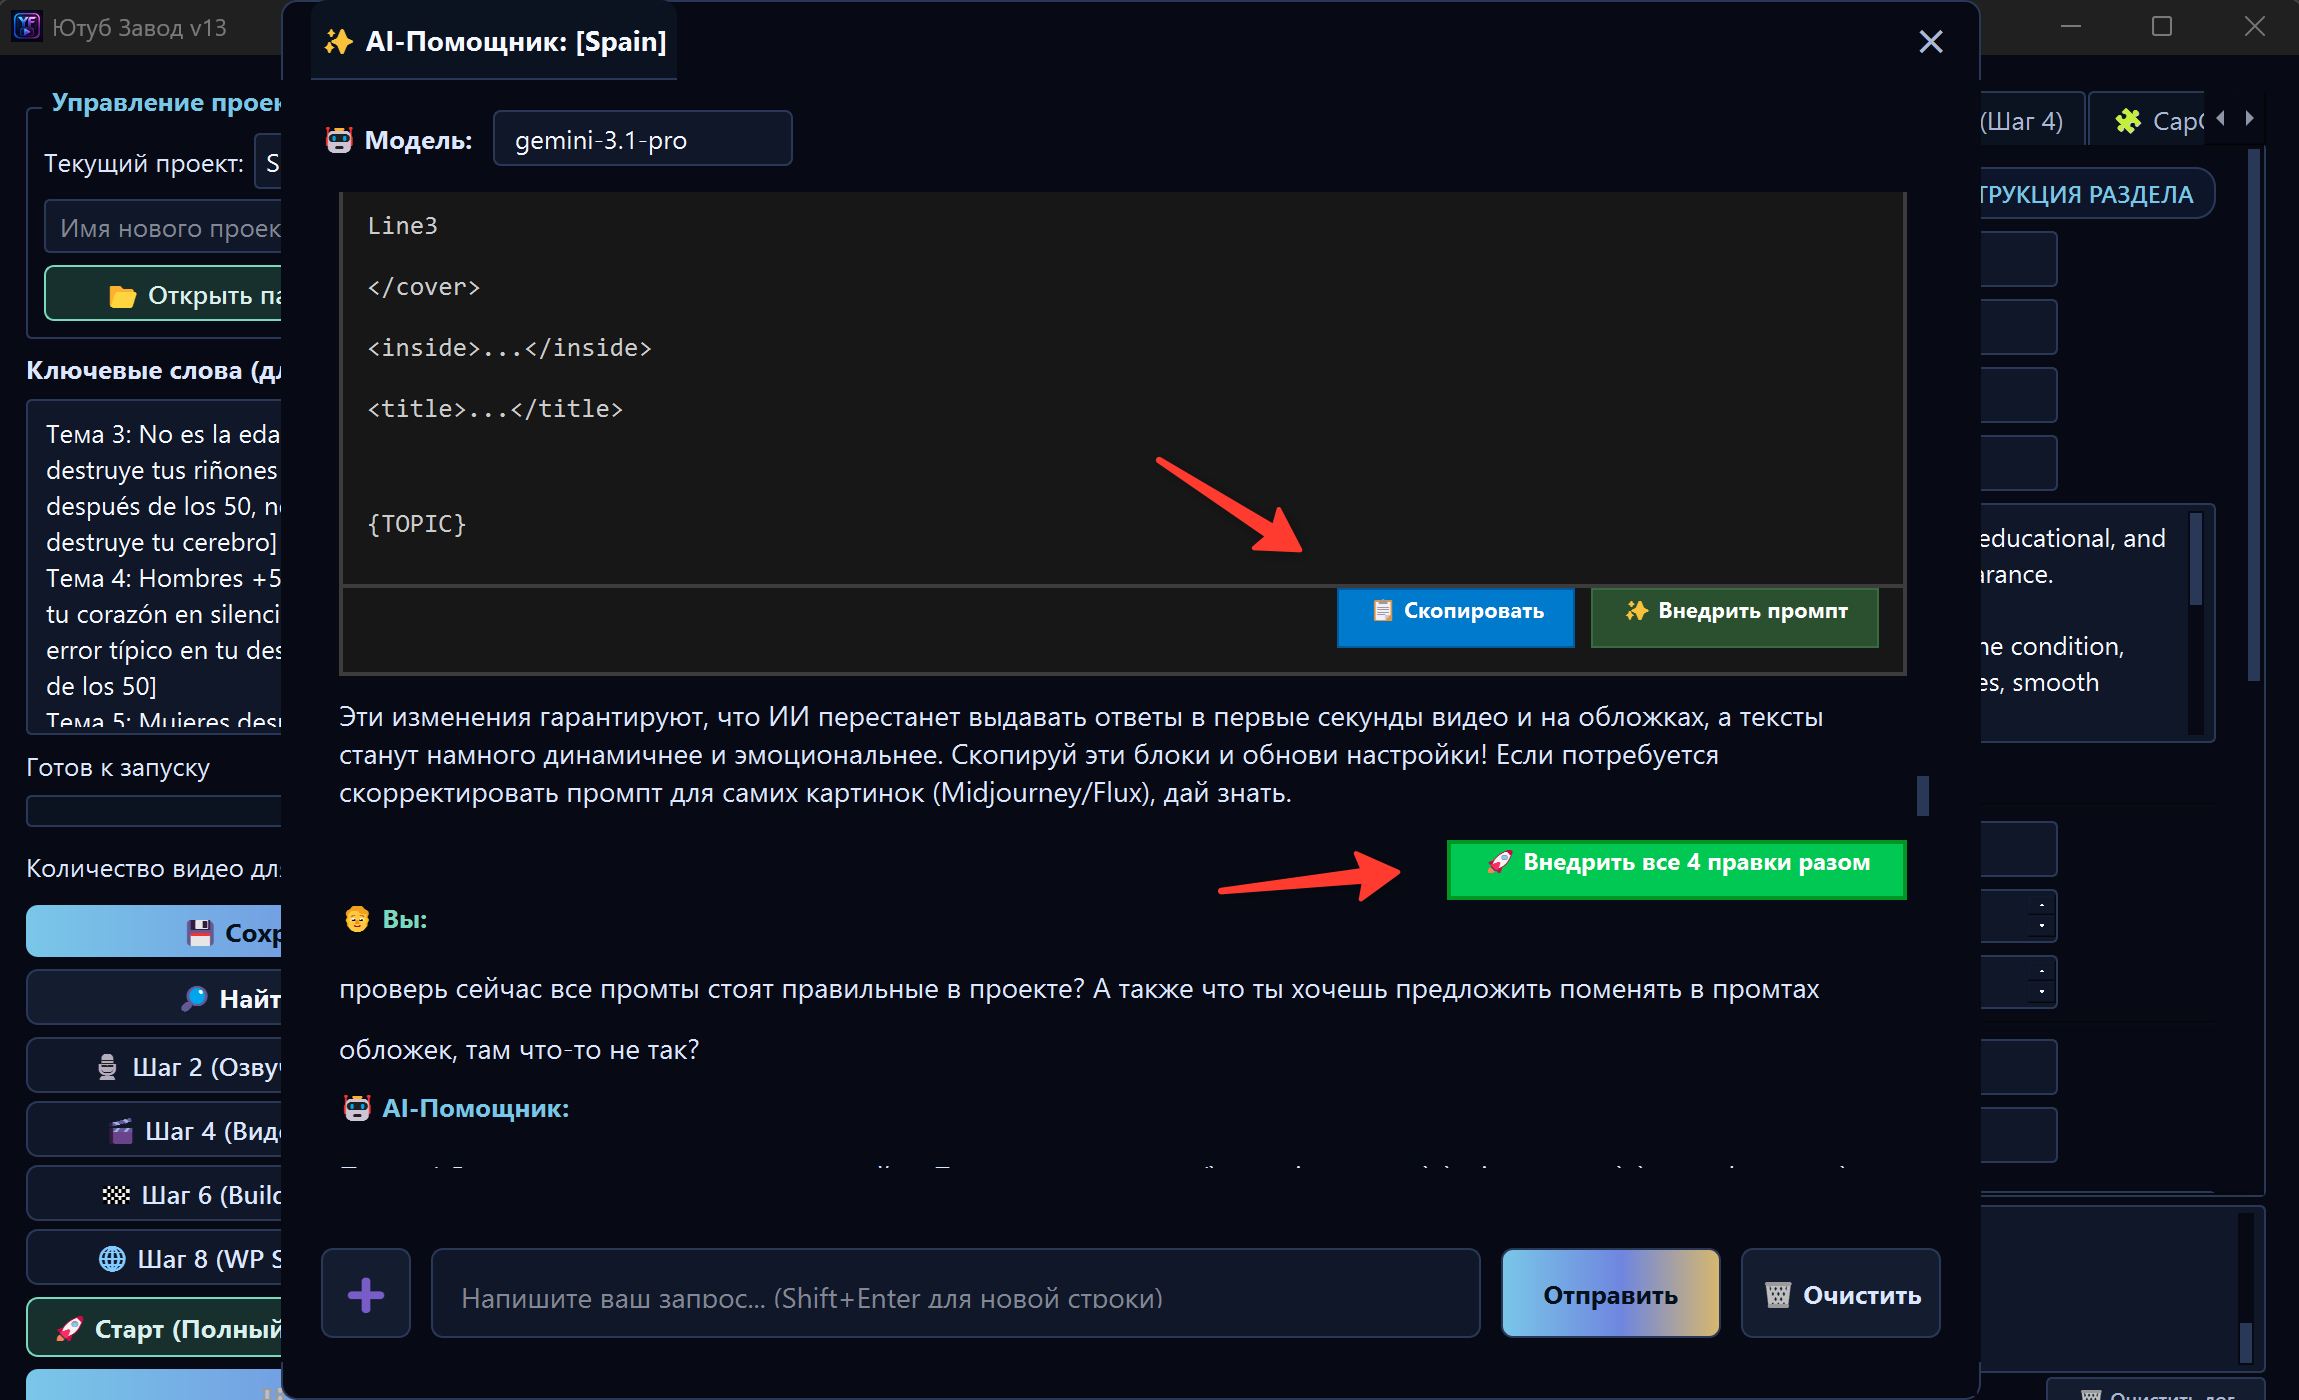
Through the AI Assistant
Open the AI Assistant and ask:
Read the Top vs Flop report and suggest which prompts, topics, thumbnails, and Scout rules should be changed so new videos are closer to the successful examples.
The AI Assistant can suggest edits and apply them safely.
Through the AI Configurator
If the whole project style needs a broader rebuild, use the AI Configurator. It can take the analytics report into account and update the prompt foundation around successful patterns.
How to know the report is useful
A useful report answers:
- what to repeat from successful videos;
- what to remove from weak videos;
- which topic type works better;
- how to change the first 30 seconds;
- what to do with thumbnails;
- how the next script should sound;
- which rules should be added to Scout.
If the report is too generic, add more metrics, screenshots, and specific videos.
Common mistakes
| Mistake | Why it is bad | Better approach |
|---|---|---|
| Analyzing only successful videos | There is no contrast, failures are harder to explain | Add both Top and Flop videos |
| Providing too few metrics | AI sees a link but not audience behavior | Add CTR, retention, duration, and comments |
| Choosing random Flop videos | Conclusions become noisy | Use videos that are truly below average |
| Not applying the report | Analytics remains just text | Apply conclusions through the AI Assistant |
| Launching many videos before testing | Mistakes scale up | Run one test video after changes |
What to ask the AI Assistant
Useful requests:
- “Explain the Top vs Flop report in simple words.”
- “Which 3 changes will most improve retention?”
- “Which Flop-video mistakes should be banned in prompts?”
- “Which Top-video patterns should be added to Scout?”
- “Make new scripts closer to the successful videos, but do not copy them literally.”
- “Should I rerun AI Configurator after this report?”
Where to go next
After Channel Analytics, continue to the AI Assistant. It helps turn report conclusions into specific safe project changes.